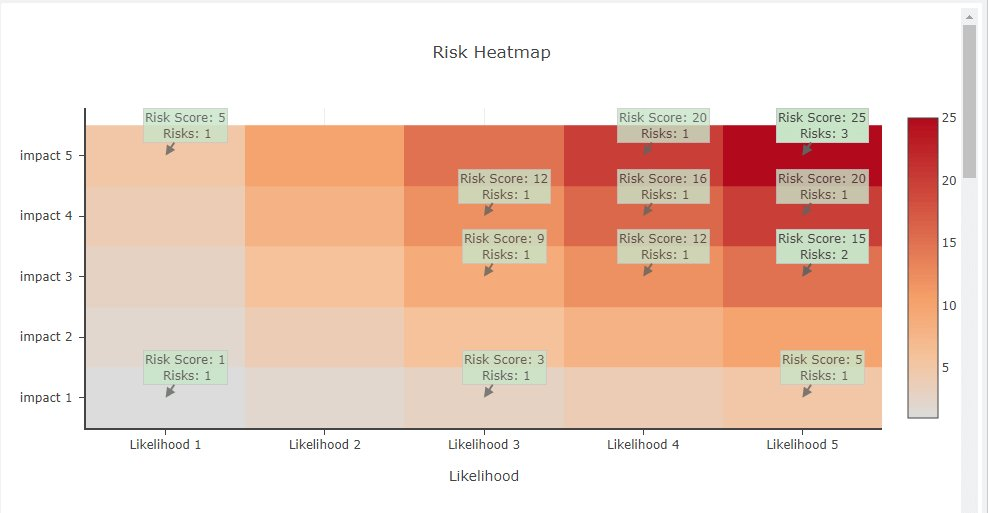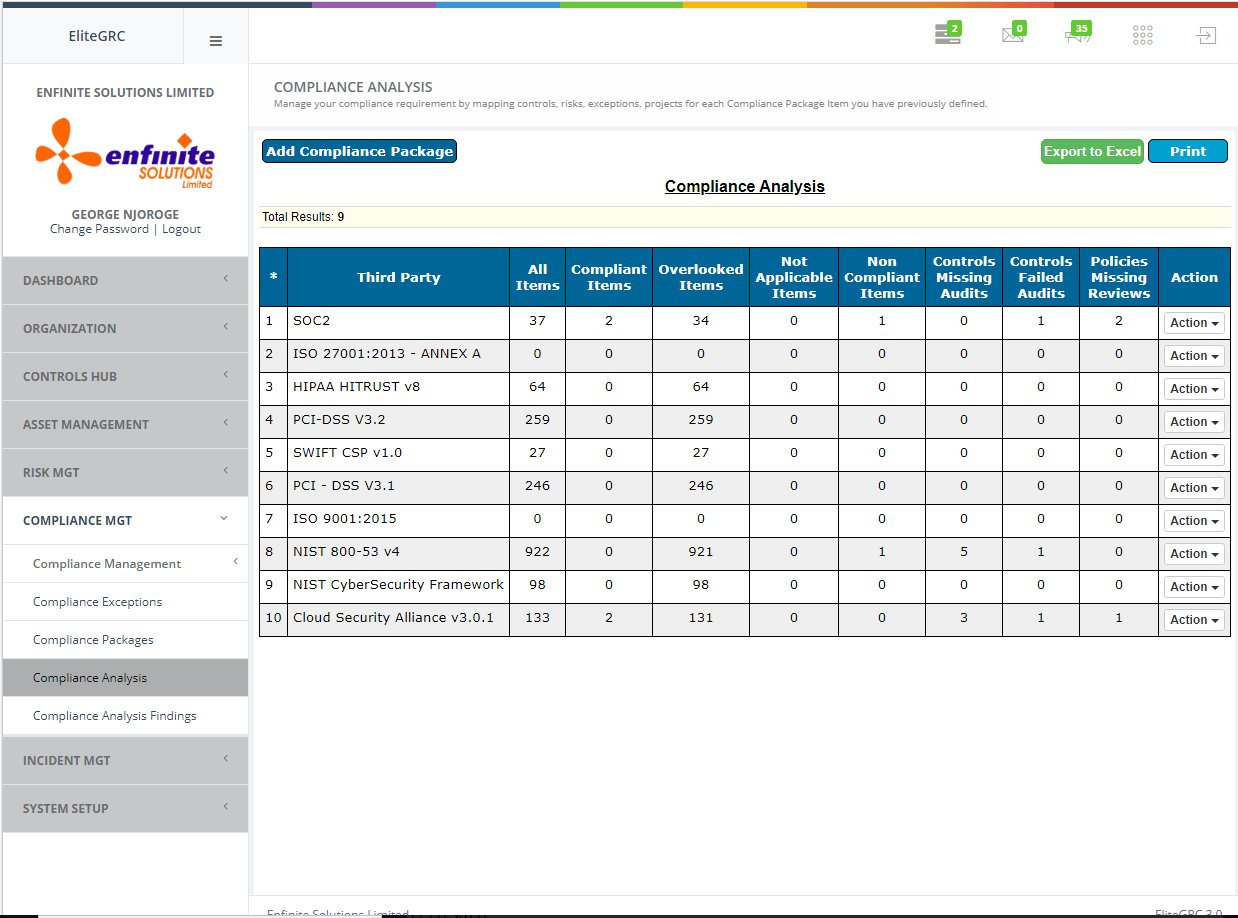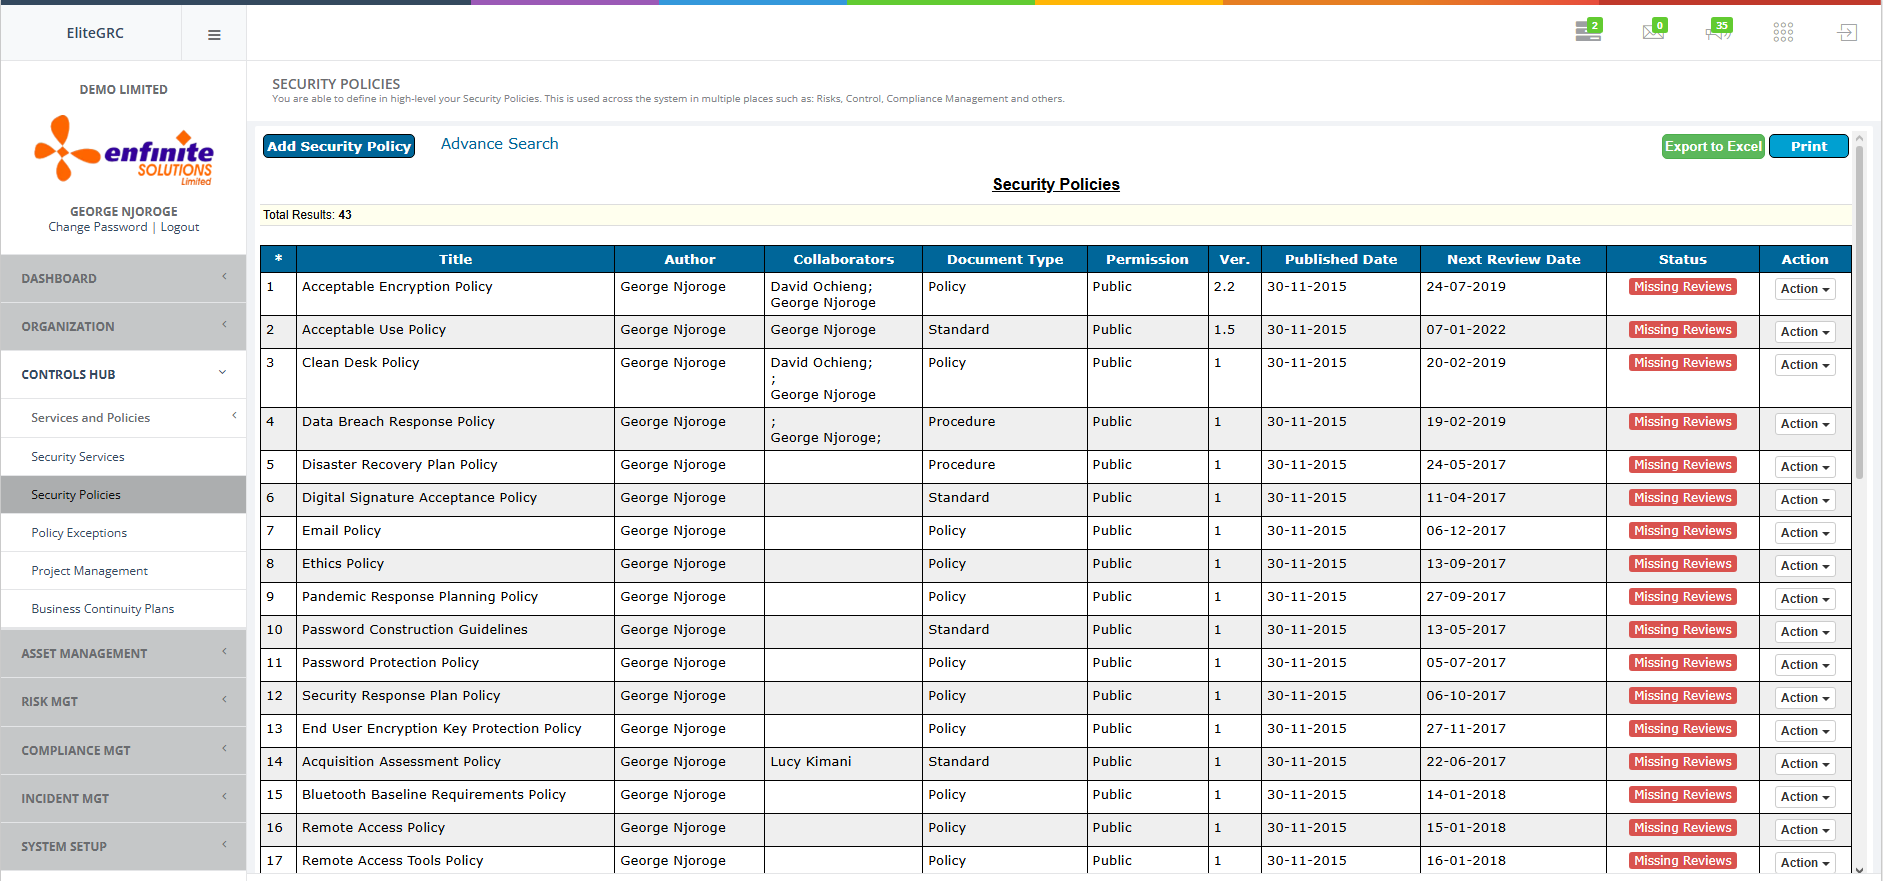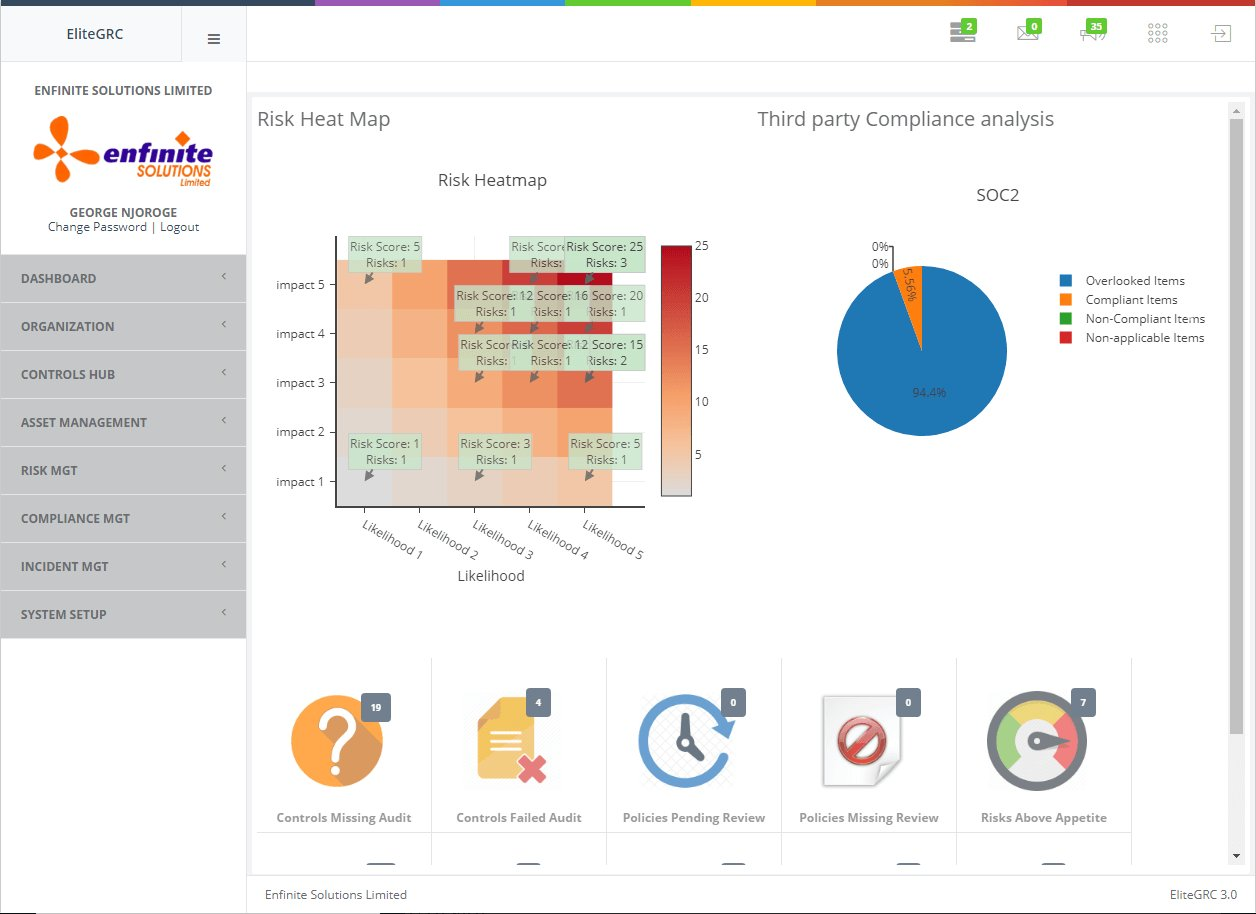
Main Dashboard - Risk Heat Map and Third Party Compliance Analysis. Illustrative screenshot, EliteGRC 3.0.
The EliteGRC dashboard gives compliance officers and risk managers an instant enterprise-wide view. The Risk Heat Map visualises all risks by likelihood and impact score. The Third Party Compliance Analysis chart shows compliant, overlooked, non-compliant and not-applicable items at a glance. Quick-access tiles provide instant counts of Controls Missing Audit, Controls Failed Audit, Policies Pending Review and Risks Above Appetite.